As Christmas 2025 approached the “staff” at the G&M were anxiously awaiting a Green Christmas. Why? Because they had just published this:
Will it be a white Christmas? A 50-year look at Canada’s snowfall on Dec. 25
The “staff” had just spent months and many long hours trying to find Global Warming. They thought that with the “unprecedented and rapid warming” currently ravishing the world, surely 2025 would be a Green Christmas. They even recruited pliant bureaucrats from Environment Canada to promote and assist their effort.
“Dr. Mudryk attributes the shift toward more rain than snow throughout the winter to climate change.“
As it usually goes with climate, always expect the unexpected and true to form there was lots of snow for the kids on Christmas Day. Oh well just another fail by the BIG BAD CLIMATE MONSTER. Sadly this is reminiscent of a few years ago when the fanatical climate zealots convinced the children that the North Pole was melting and Santa was going to die. Just another day in the climate fear machine.
Shifty is working diligently to characterize the Canadian Climate and as promised the Canada Heat Project is progressing and the “St Lawrence Valley Heat” post will be published very soon. In the spirit of Christmas however, I took a little detour and looked for Climate Change in the snow data just to see if the apocalypse can be found there. Spoiler alert there is no change in the snow record beyond what we expect to be present with the current warm cycle.
Before we get into the snow data, let’s deal with the concept of “mean” temperature. In the introductory post on this blog we saw how using the mean temperature as a bench mark conceals the true nature of any warming or cooling. Using the mean temperature makes it impossible to know if the increasing mean temperature is for example, due to more hot days versus less cold days or is it caused some other phenomenomn. It makes the data less enlightening not more, that’s why folks that are wrong and promoting unrealistic propaganda like to use the mean temperature and cloud the issue.
An example of the benefits of using Tmax and Tmin individually is clearly shown in the “Urban Heat Island” post on this website. Readers are encouraged to check out the post “Toronto: An Example of an Urban Heat Island”. The post uses the very best and most complete data set in the country located in the Heart of Toronto to clearly show the effects of urbanization. By comparing the Toronto data with another very complete and lengthy dataset from a rural location about 300 kms north at Beatrice Ontario the effects can be clearly seen.
I mention this before we get started with the “Snow” data because it seems the “staff” at the G&M realized their work was not yielding any results from looking at the snow data and something had to be done to beef up the scare tactics. As usually happens when the data doesn’t play along the alarmist resort to obfuscation using this statistical manipulation to make urban development in places Like Toronto, Montreal or Vancouver “appear” as global warming.
Another trick the alarmists like to use is to select the starting point for their “investigative” journalism. By using 1975 the authors guarantee to hide the fact that it was warmer on a continental scale in the 1920s – 1930s and it was much much colder in Canada prior to the 1900s. This is a common tactic used to deliberately hide the reality of a naturally variable climate. We here at FTDOS use data with long records dating back to 1875 and in the Introductory Post we clearly demonstrate the effectiveness of this by using datasets from places across the country like Charlottetown PEI, Sydney NS, Montreal, Toronto, Winnipeg, Calgary and others. I encourage readers to check out this Introductory Post at the beginning of this website.
So let’s continue with this robust and transparent process and look at some data to see if we can find “Climate Change” in the Snow Dataset.
***NB: Just to keep it simple I’ve created a “average daily snow” metric. Simply put this is the total annual snowfall in centimetres divided by 365. Keep this in mind as it is the unit used for the following graphs.****
Let’s see some examples:
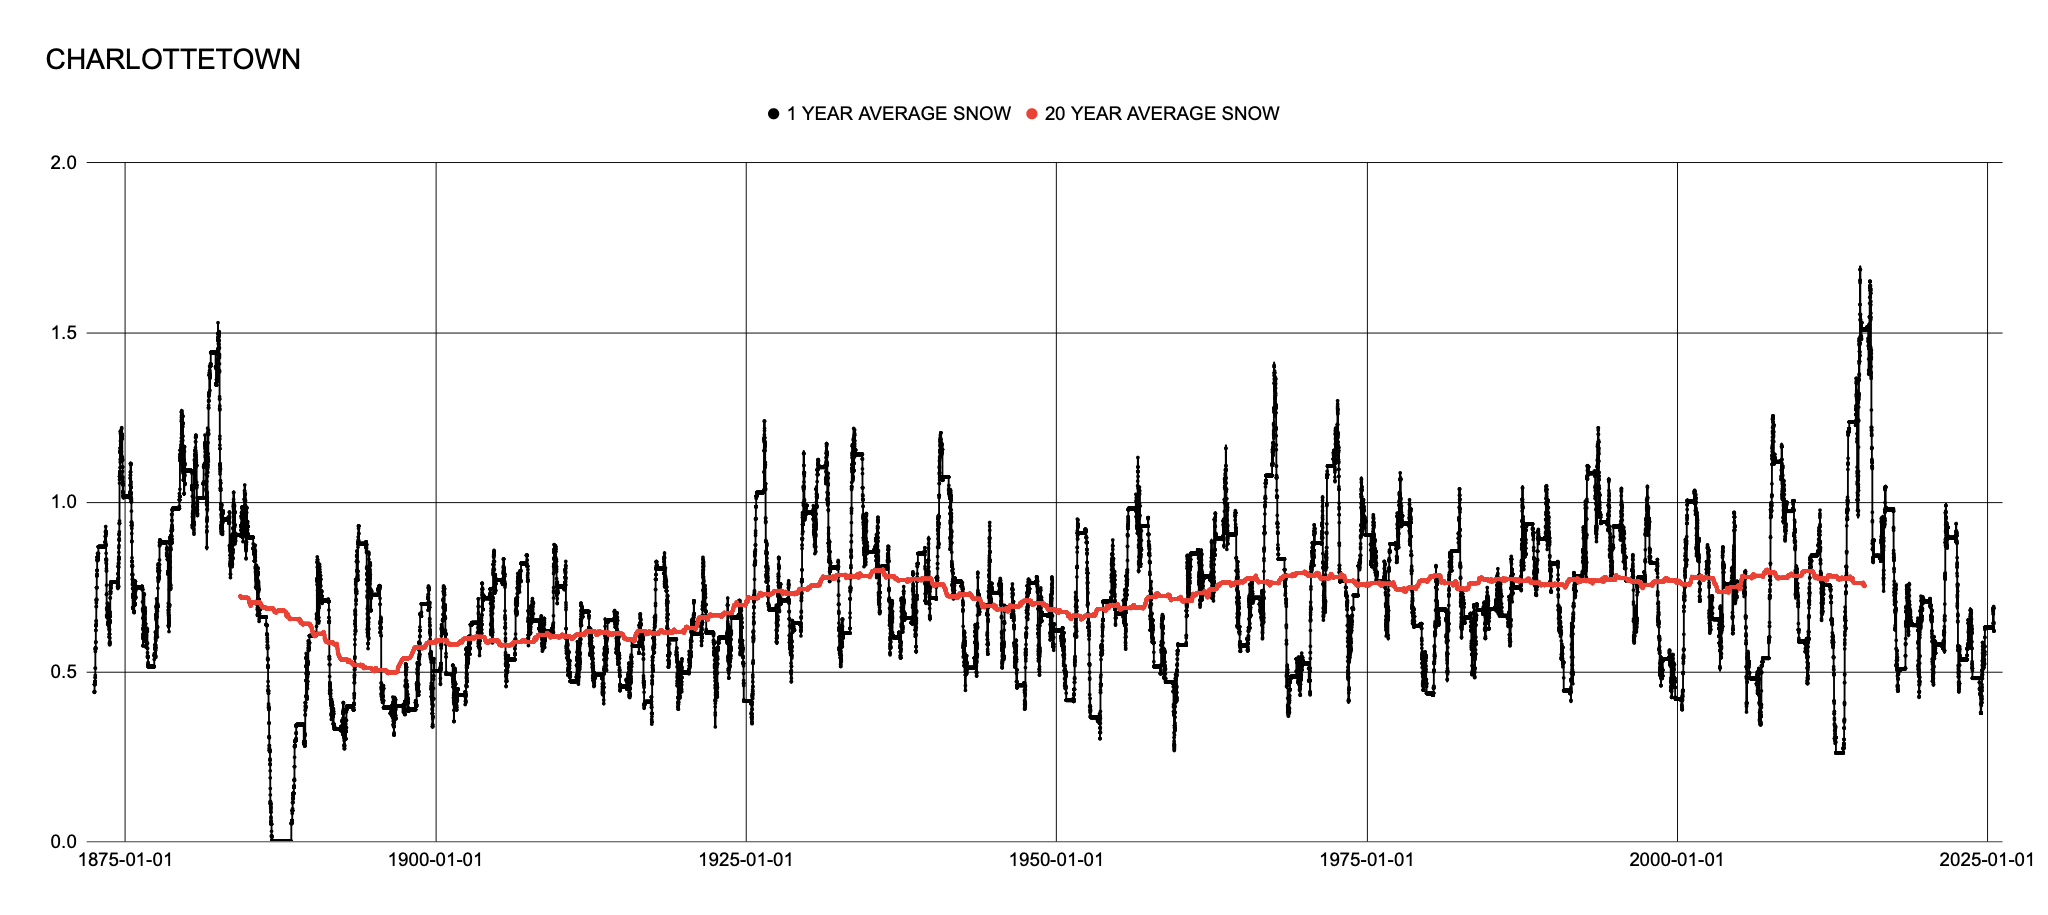
The Charlottetown snow data speaks volumes. This should pretty much end the discussion as there is clearly no trend in snowfall with the exception of a much snowy past prior to 1900 and peaks at around 1880. But let’s keep going this should be fun.
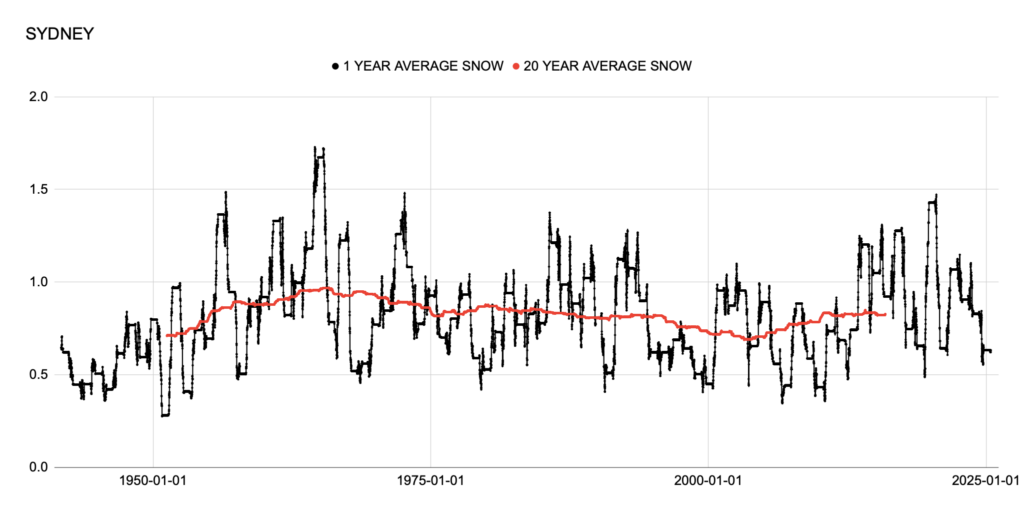
The Sydney snow dataset is a bit disappointing. The temperature data is a very high quality long lived record going back to 1870s. Unfortunately the snowfall data only goes back to about 1945, but again no trend in snowfall in the modern are.

The dataset from St John’s is a surprise. While showing no trend during the modern era there is a very pronounced drop in snowfall around 1875 – 1935 with a short data gap from 1925 – 1930. When you point this out to the true believers they call you a denier!!!! They refuse to accept the incredible natural variability of climate.
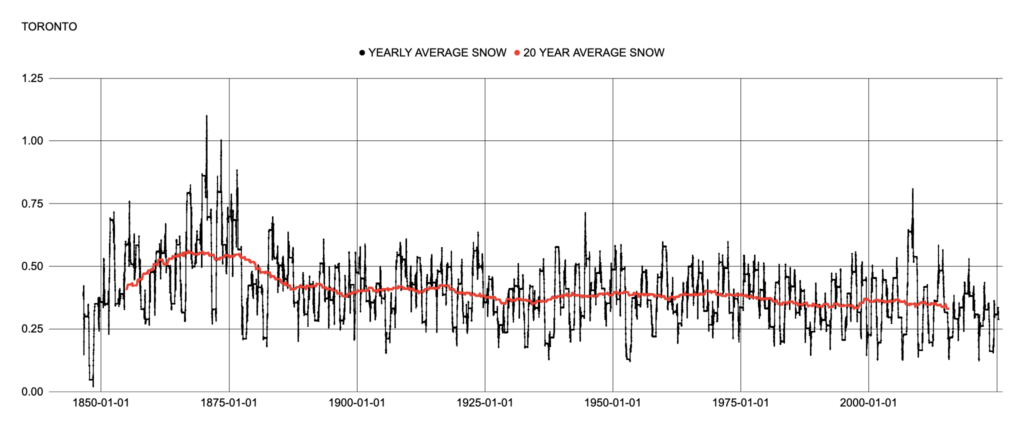
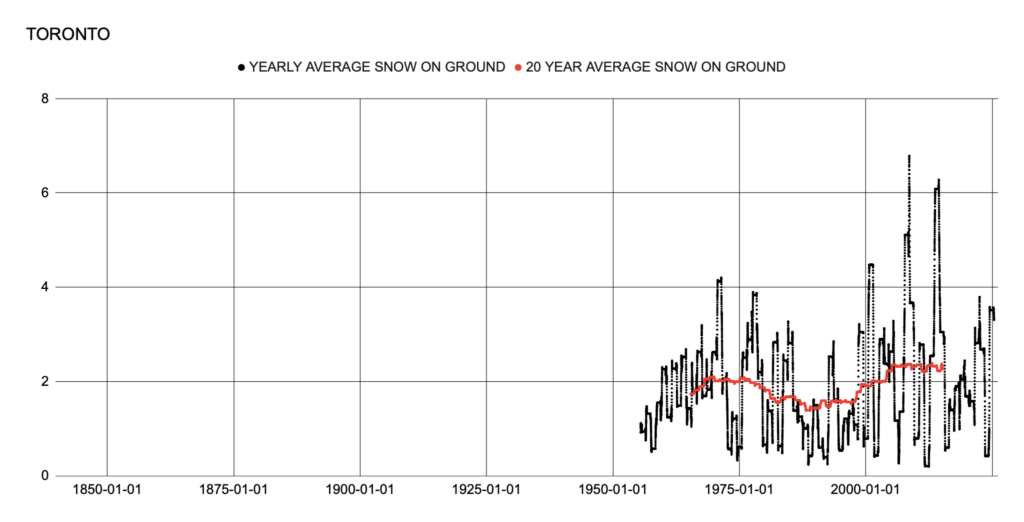
Let’s look at Toronto. This is a beautiful dataset. The temperature and precipitation record are the longest running; starting prior to 1850, and the most complete dataset in Canada with very few “null” records. We were able to use this dataset to show the effects of urbanization on temperatures. Can we do the same for the snowfall data? As we’ve seen in other locations that start prior to 1900 there is a marked increase in snowfall around 1875. In the Toronto record this is expected, our temperature investigation showed marked cooling prior to 1900 and this would be consistent with a bigger annual snowfall average. The snowfall data from about 1920 onwards shows a long term gradual decline in snowfall into the modern era. “CLIMATE CAHNGE” the alarmists say. Not so quick says the data driven “Climate Realists”. Let’s look at Beatrice, Toronto’s “Climate Sister” location.
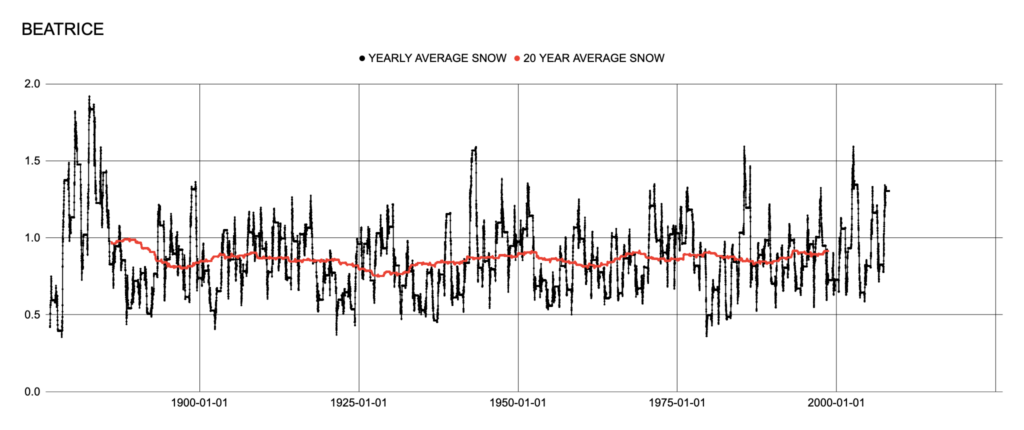
Sure enough we can see the pre-1900s anomalous snowfall data but there is no decline in snowfall as we approach the modern era. Instead we have a record that shows an increase of snowfall as we approach the modern era. The most sensible conclusion is the Urban environment of Downtown Toronto, not surprisingly has caused a gradual decrease in the snowfall record.
As an aside we should talk a little bit about the closing of certain data stations. In this example we use Beatrice but we can’t continue beyond about 2010 because the snowfall data is no longer recorded. In Canada and many other countries the governments use the global warming alarmism to promote their intrusion into the average man’s life while simultaneously reduce funding for the measurement of this data.
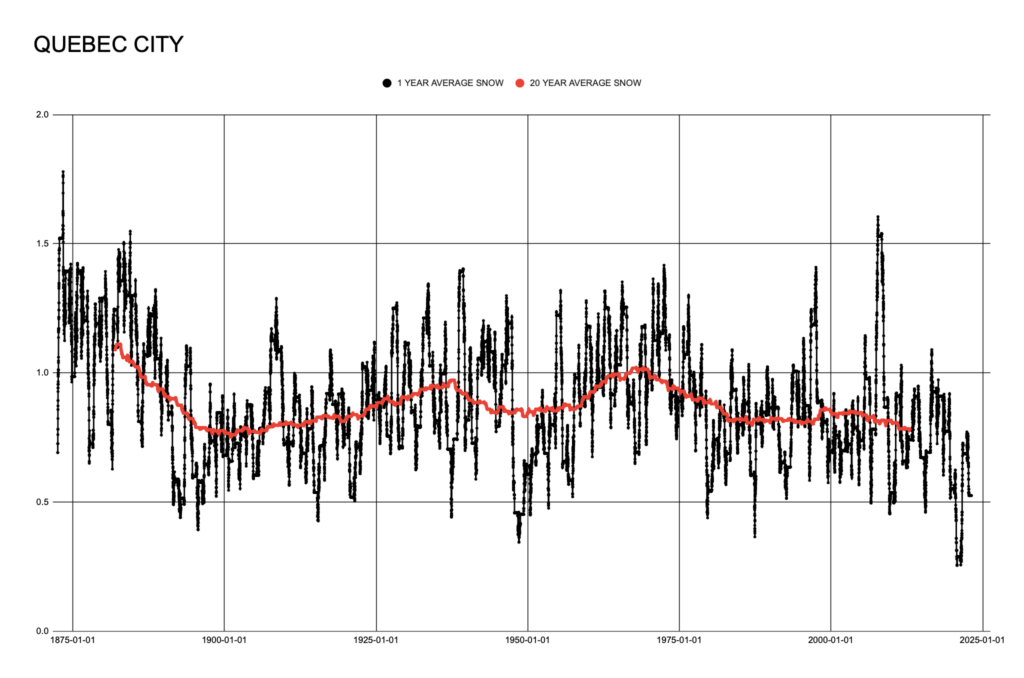
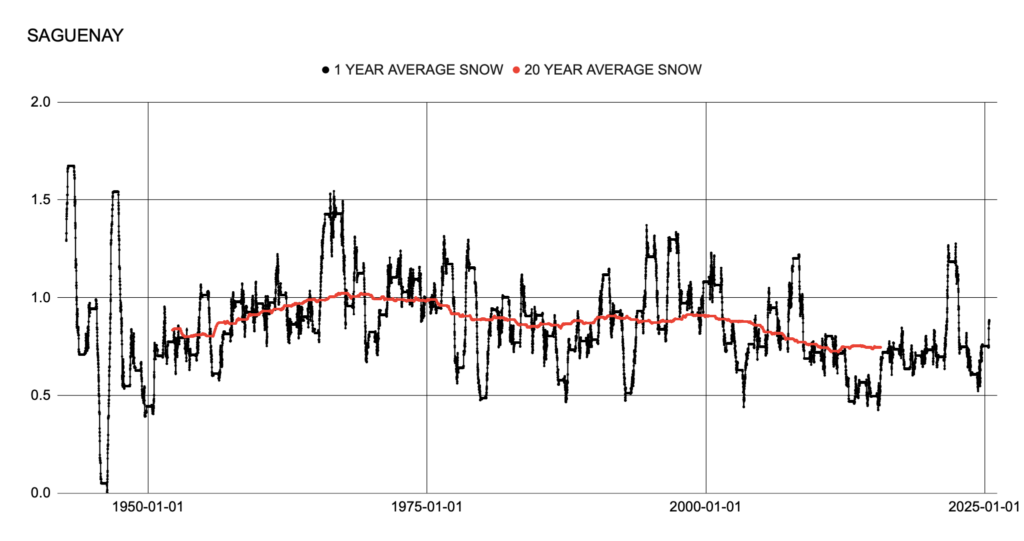
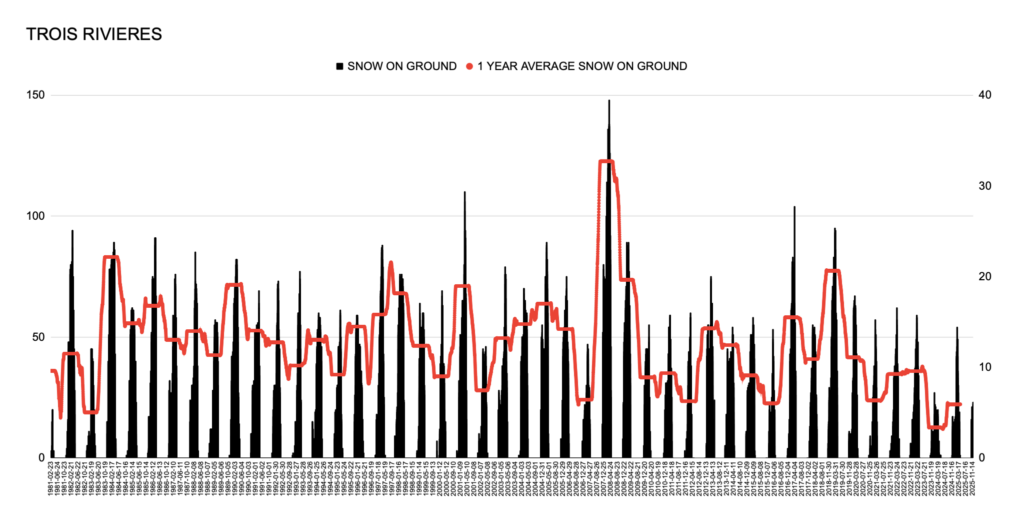
The snowfall data for Quebec City going back to pre-1875 shows a dramatic reduction in snowfall in the 20 years pre-1900. This pattern is unmistakeable and I clearly a result of the natural warming at the end of the 1800s. Pointing to the most recent 5 years of data is like someone living in 1890 screaming the sky is falling because of milder weather. Truly BIZZARE.
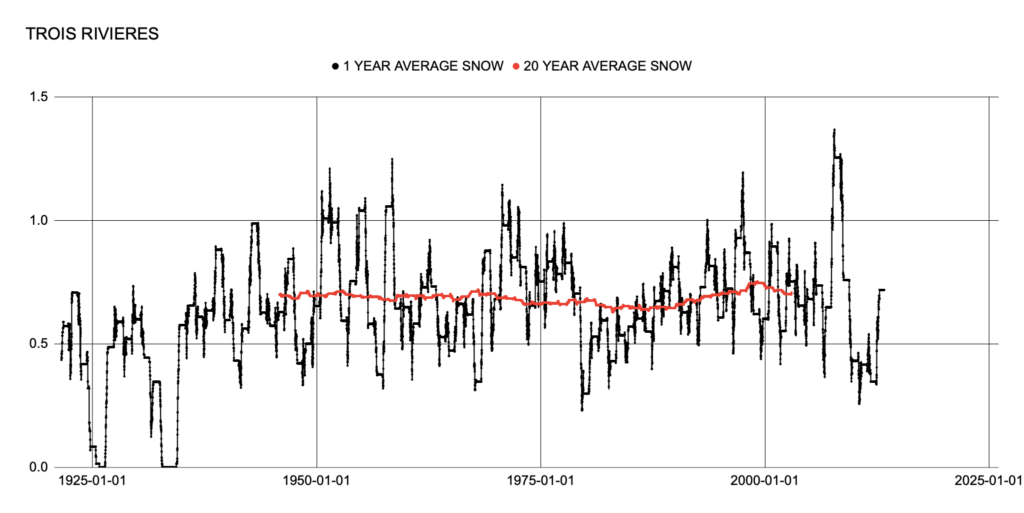
But it doesn’t stop there the same is happening in other cities as well.
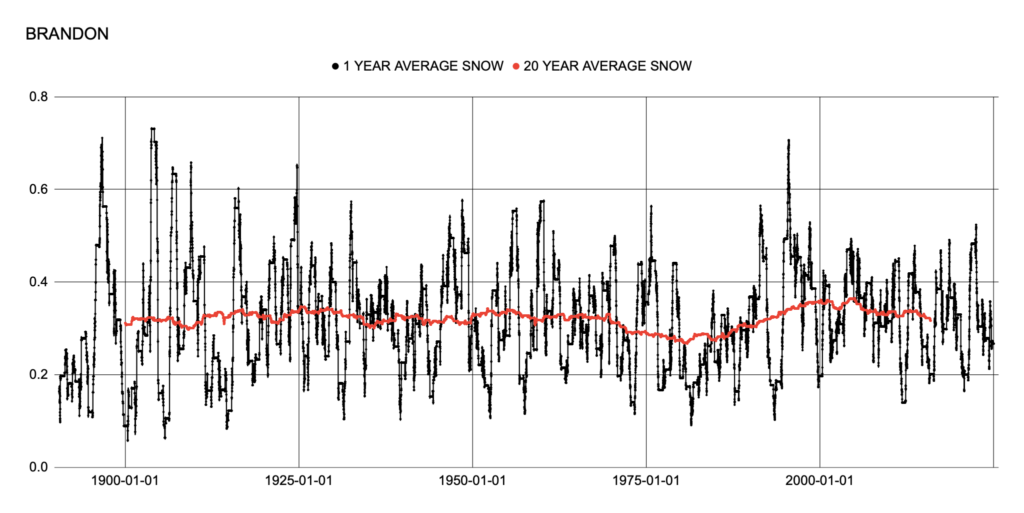
Brandon experienced a significant snow “drought” from about 1970 -1995. This was not a precipitation drought however as the total precipitation data does not show the same trend, total precipitation was unremarkable, in 1970-1995. Again, there is no downward trend in the snowfall data in the modern era.
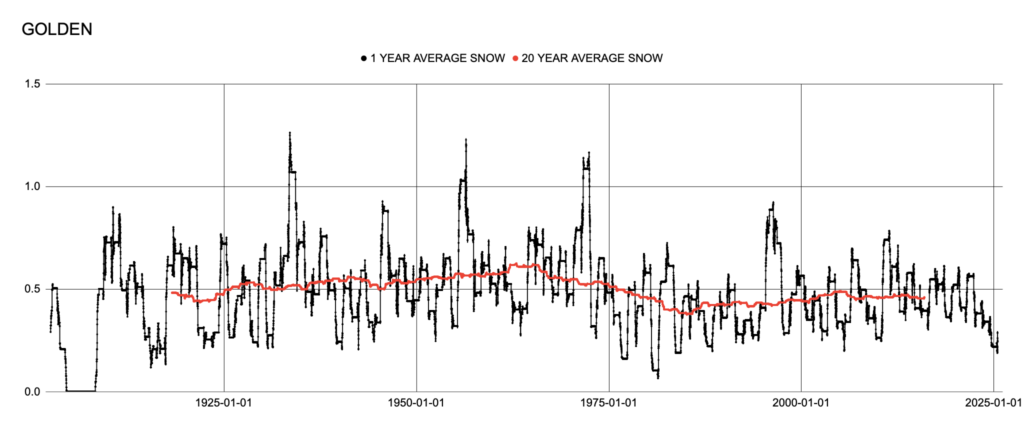
Golden’s snowfall trend has ups and downs but currently the average is about equal to 1920’s.
I’ve included these sites for interest sake as they were mentioned by the “staff” at the G&M. not sure why the “staff” preferred shorter records…..Oh yeah I do know, but we’ll talk about that later.
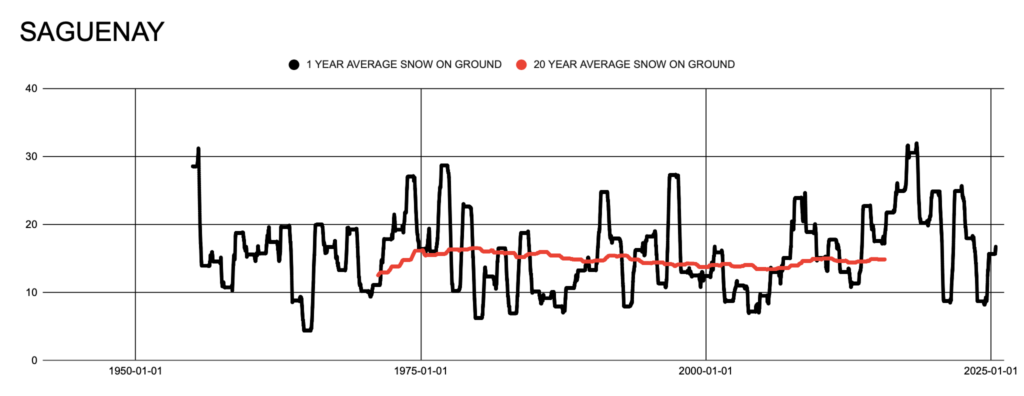
Another parameter included in the database recorded by ECCCis “snow on the ground” unfortunately the records for this parameter start at the earliest in 1950 and often even later. This data is much more sparse than the temperature dataset but the data seems well maintained so we can use it where it is present.
The G&M make a big point about declining snow on the ground in the last 5 years. As we will see this is not surprising in light of our current warm climate. Imagine creating an article for the news or research but limited to only data before 1950.
Let’s see what they found. Below is a quote from the article
“Banff and Whistler, two of the country’s most famous ski destinations, have experienced some of the largest Christmas Day snow losses on the ground among all cities studied.”
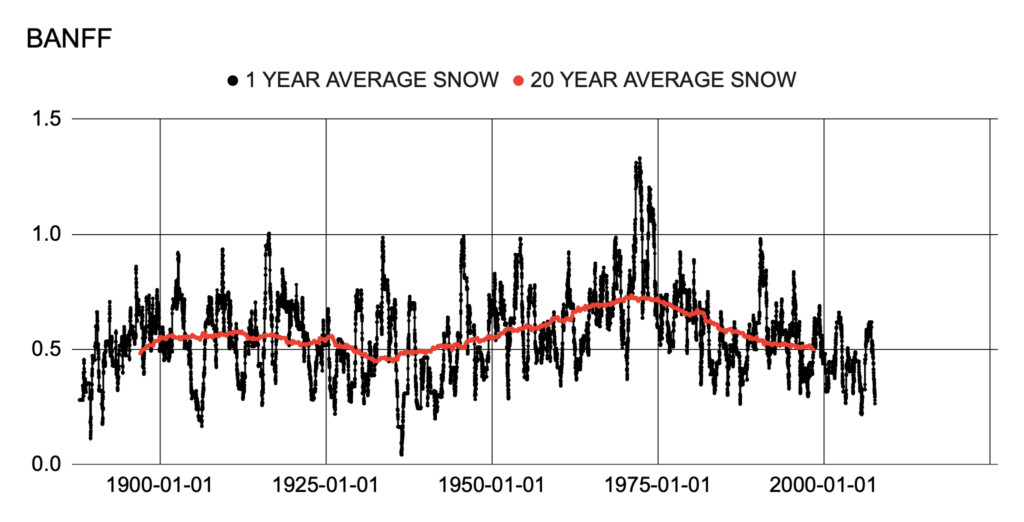
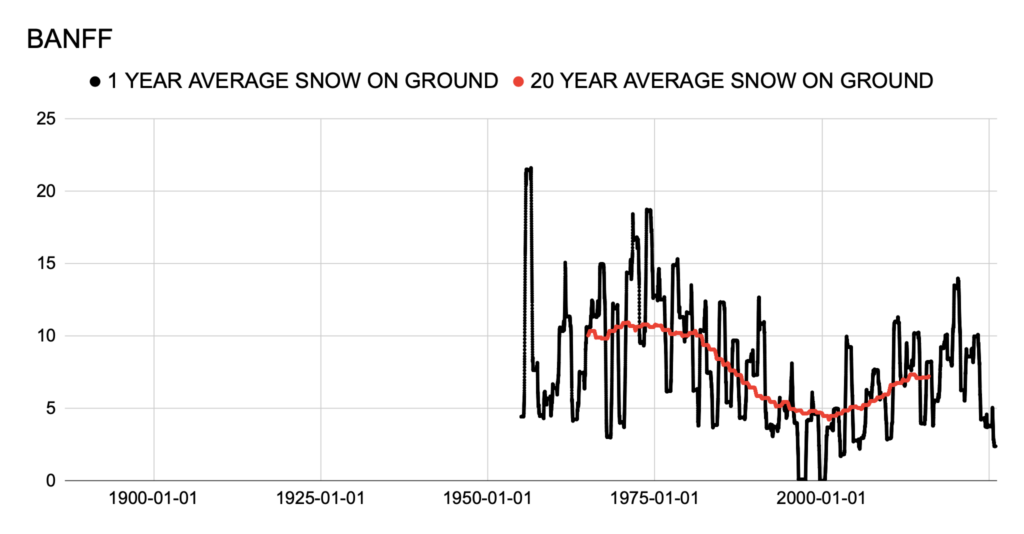
The statement above while possibly true does not accuratley reflect the reality from a climate perspective. In fact the modern era shows about the same snowfall history as was occurring in the 1930s. Again we find there is no longer a data station recording snowfall at Banff. If you were so inclined you could restrict your analysis to just the snow on the ground data but you would find that since the low in 2000 the snow on the ground has actually rebounded.
What about Whistler?
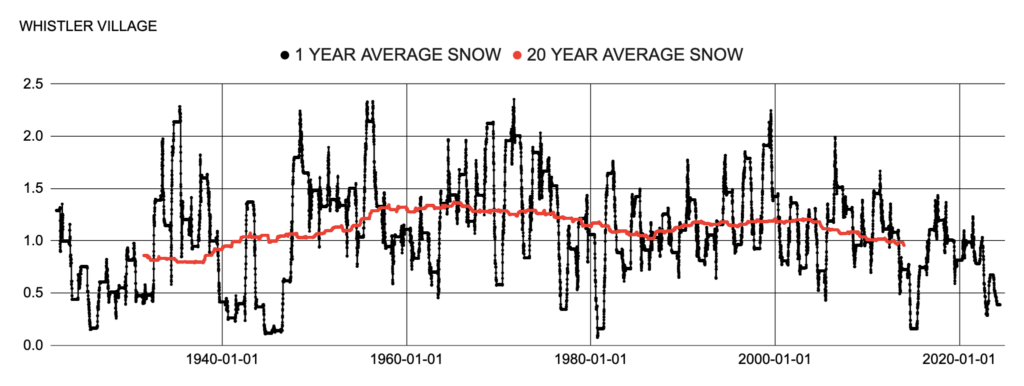
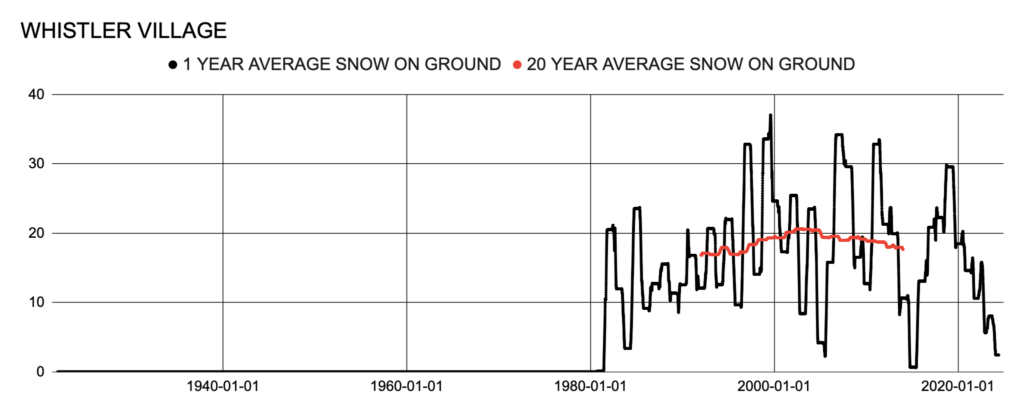
The snowfall data at the village elevation indicates there have been years with very low snowfall around 1940-1946, 1980+/- and 2015. The long term 20 year average snow on the groundalso supports a natural variation of snowfall in the modern era.
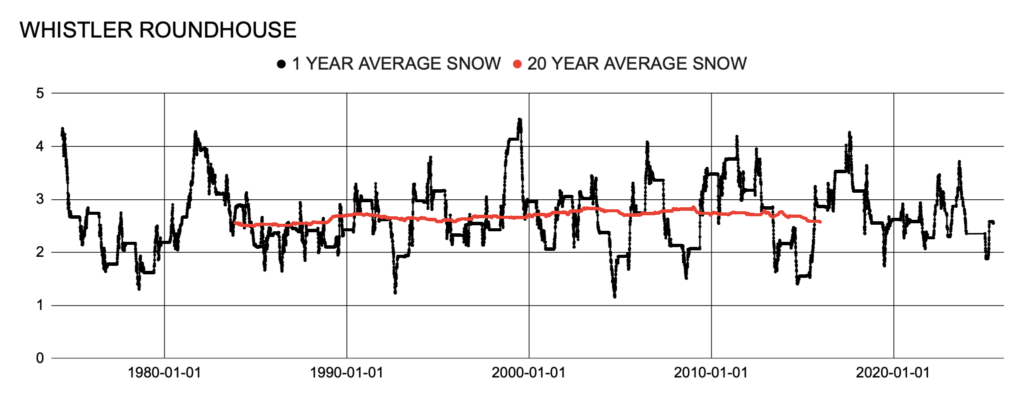
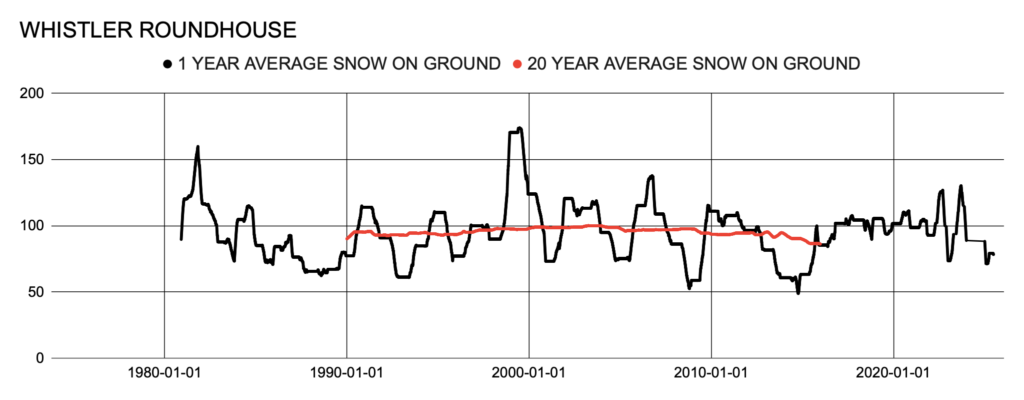
The data clearly show there’s nothing unnatural going on at the Whistler Roundhouse data.
So no, we still have not found “Climate Change”.
Well the “staff” at the G&M are willing to try one more little trick. The ol’ the last five years have been warmer, or as in this case less snowy than the previous, in this case, 50 years. This is an interesting metric for determining the cause of current weather anomalies. Remember by definition half of the data will be warmer and half will be cooler than the average, for any 5 year period it’s a 50/50 probability.
It seems the last five year hoax is driven by the 2024 snow season. We’ve seen enough examples to know that there are years with low snowfall amounts in the modern era as well as in the past 100+ years so no this is not ‘Climate Change”.
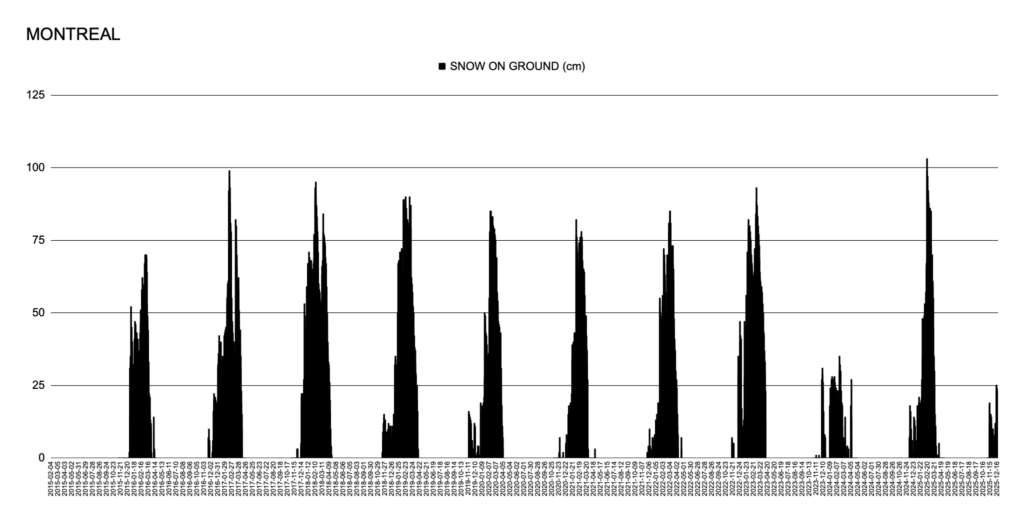
As we come to a close I wonder why the article brushes off the very real example from the heart of Canada’s biggest city, Toronto. Remember Toronto is hoe to the very best data available in the country. Here’s the quote from the article.
“The long-term and recent average snow depth on Christmas Day remain fairly unchanged in Toronto, but that doesn’t mean uneventful year-to-year change. In fact, the city has swung between deep snowpacks and bare ground on Christmas over the past 50 years.“
The graph below clearly shows why this data was brushed aside.
In summary, we’ve seen that the more you look at actual data the less likely it seems that we are facing unnatural catastrophic global warming.
When journalists use their position to influence rather than inform, they are not doing their jobs. When employees in the bureaucracy participate in this with little regard for the integrity of the approach, they are in conflict with their obligation to serve the citizens and not the government.
deceit | dəˈsēt | noun
the action or practice of deceiving someone by concealing or misrepresenting the truth.
I’ll leave it at that.