I’ve been meaning to do this for a while. It seems you can’t watch or read any reporting these days without hearing about extreme heat. Then you hear on the streets everyone talking about how hot it is (my apologies to the folks in places like Calgary where since the end of Stampede the daytime highs are struggling to get above 15 degrees). These Merchants of Doom want to believe the temperatures- well within the normal seasonal norms – are somehow EXTREME and obviously caused by CLIMATE CHANGE!!!!! Oh my.
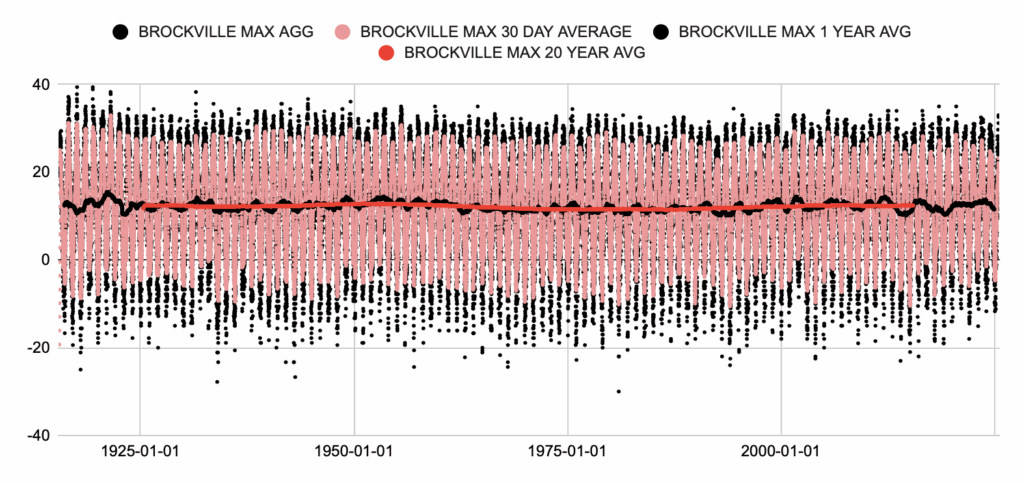
The graph above is the data recorded and stored on the government database for Brockville Ontario. The data starts at around 1915 and I’ve included all the data up to June 2025 (my last download). At first look nothing really jumps out, well, nothing except the really warm summer temperatures around 1915. In fact the hottest temperature ever recorded in Brockville was 39.4 C, on July 17th 1917. That IS hot.
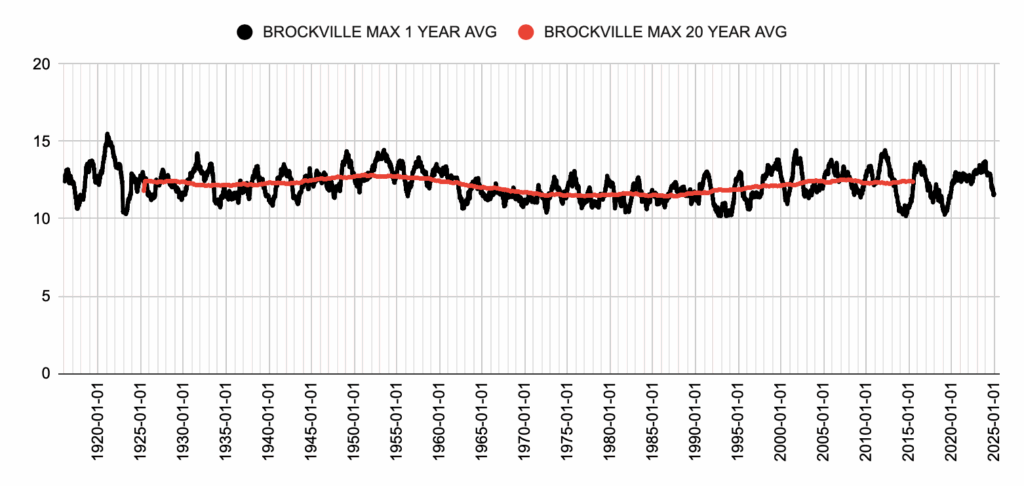
If you’ve been following my earlier posts you will recognize the graph above. It provides a more detailed picture of what’s going on. While still on the warm side, since about 2012 temperatures are moderating slightly. Certainly there is no indication of increasing temperatures. Let’s look a little closer.
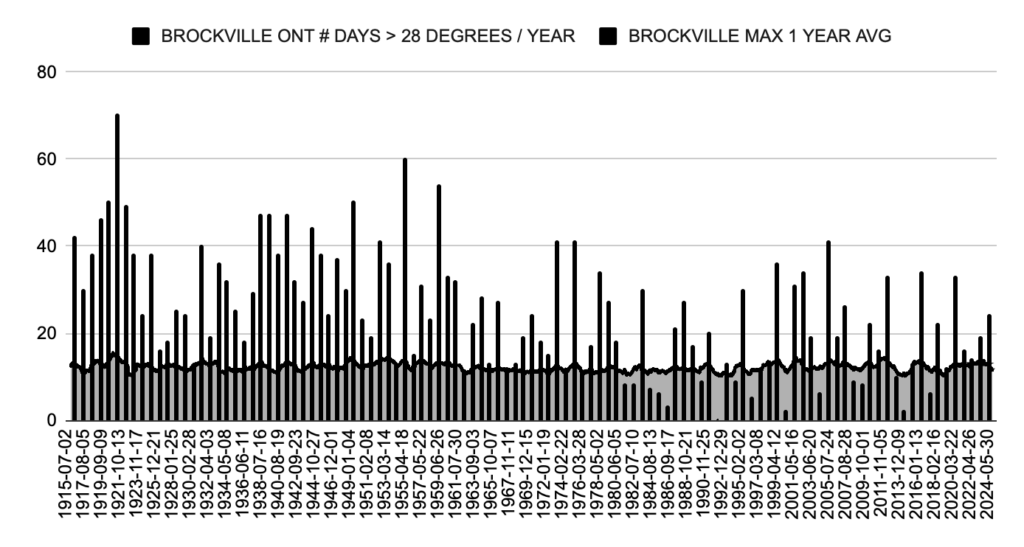
The graph above shows the number of days in a year with a high temperature greater than 28 degrees. Clearly not a match with the rhetoric from the media and the man on the street that both claim it’s getting hotter with more hot days than “before”.
Many folks then claim it’s not only getting hotter but the hot weather is also occurring over a longer period.
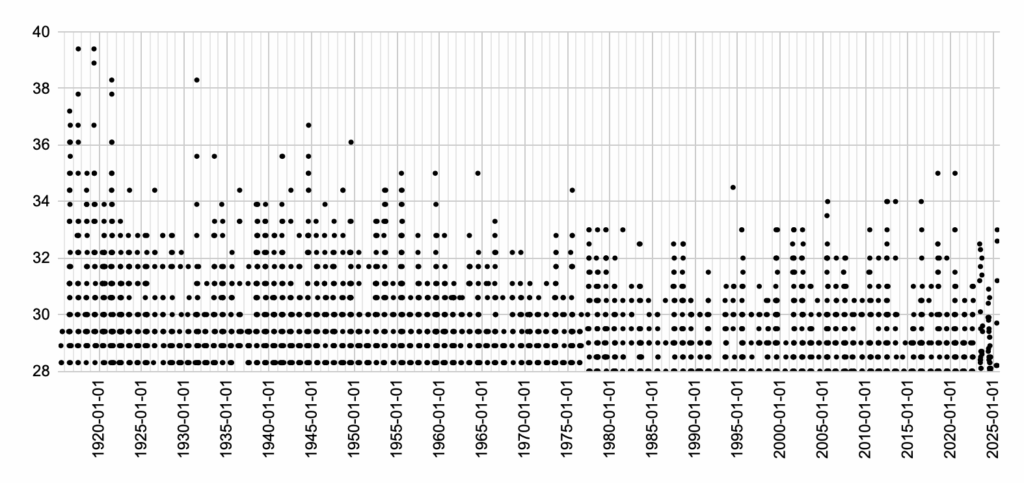
The graph above is the daily high temperature with the graph starting at 28 C. WOW it sure was hot in the 1920s, and the warmth persists until the late 1950s. Then cooler until about 2000, then warm again but only slightly and nowhere near as warm as the 1915 – 1922 period. We’ve seen this in all the records we’ve looked at so far but maybe we are missing something. With more detail maybe we’ll see there are a bunch of hot days outside the typical summer season.
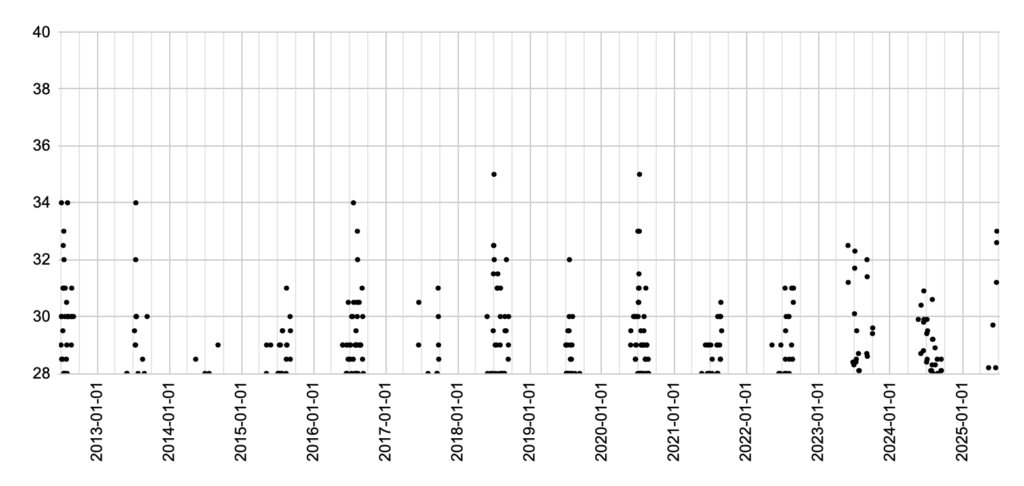
The graph above spans about a dozen years up to the present (the warm days in late June 2025 are shown and to date are the warmest so far this year). The scale allows us to resolve the four seasons. If there are earlier hot temperature days in the early spring or late fall we should see this trend. Let’s compare this with the earlier cool period in the 70s.
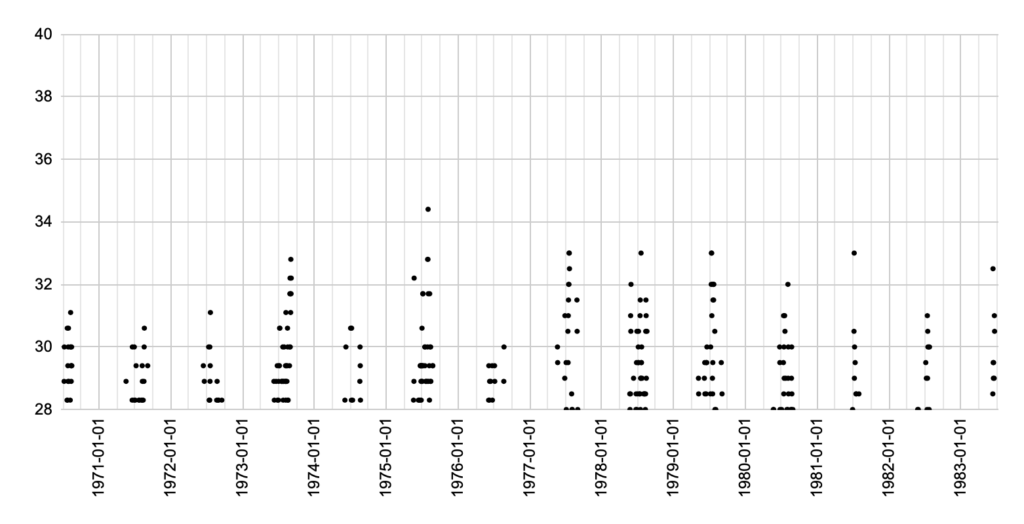
This graph spans the years from 1970-1983. Not much change from the current data. Also the seasonal range seems about the same. Hmmm.
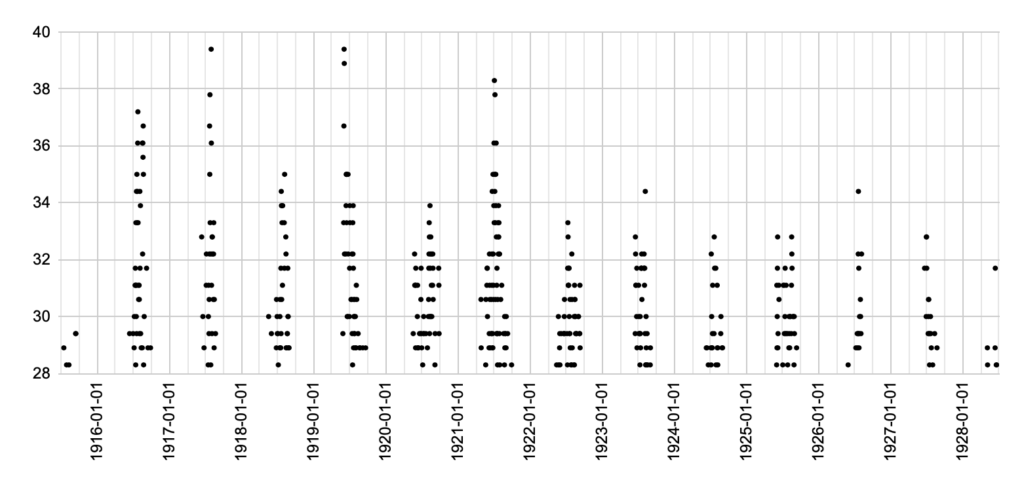
Wow. When we look at the 1915-1928 data there is a clear, unmistakeable warming of the maximum temperature. The seasonal range, however, does not seem to change, the middle six months of the year are the hottest.
So no, it’s not getting hotter and the weather in the summer is not extreme! The data does not match the rhetoric.
STOP THE MADNESS!